The relentless bullish euphoria gives way to a more uncertain consolidation phase.
Leer este artículo en español 🇪🇸
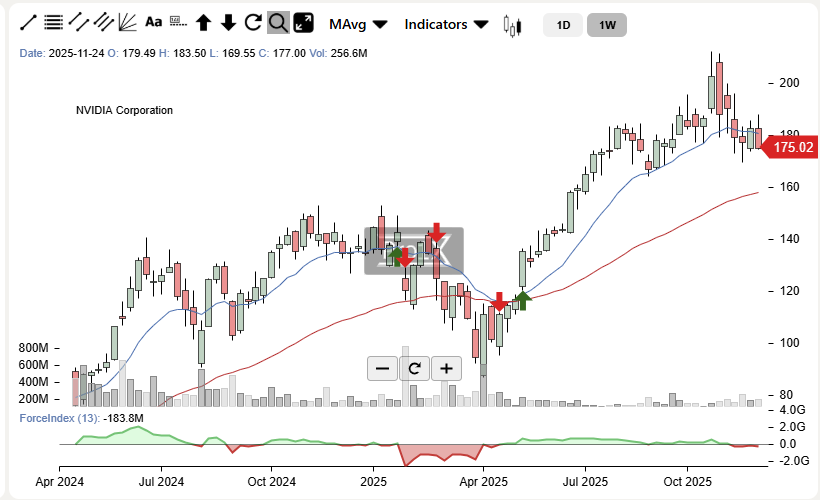
NVIDIA’s share price continues to show clear signs of momentum deterioration following the strong bullish advance seen in recent months. Price action remains locked in a well-defined sideways structure, characterized by fading directional conviction and rising intraday volatility — typical features of a transition and consolidation phase.
From a short-term perspective, the stock is trading within a range with a downward bias, reflected in the inability to sustain rebounds and in persistent selling pressure emerging near the upper end of the range. On a medium-term horizon, the price behavior is consistent with a broader consolidation phase, aimed at digesting prior gains rather than immediately resuming the primary uptrend.
On the upside, the $184 level continues to act as the first meaningful resistance, repeatedly capping recovery attempts. Above this area, $196 stands out as a more significant technical reference; a sustained move through this level would be required to improve short-term momentum. Further up, the $215 zone represents a major resistance, and only a decisive break above it would restore a clearly bullish technical structure.
On the downside, $170 remains the key near-term support to monitor closely. A sustained break below this level would materially increase the risk of a deeper corrective move toward $155, with $145 emerging as a more structural support within the broader consolidation process.
From a projection standpoint, as long as the price manages to stabilize above immediate supports and reclaim key resistance levels, bullish extensions toward $195 and subsequently $210 could be activated. Conversely, a clear downside break from the current range would shift focus toward $160, and in a scenario of accelerating selling pressure, toward $140 and potentially $120.
Overall, NVIDIA is undergoing a technical adjustment phase, as the market reassesses price and valuation following the prior sharp advance. Until a decisive breakout from the current range materializes, price action is likely to remain dominated by caution, with a more tactical approach and close monitoring of the key levels that will define the next directional move.
Top Traders League
Resistences: $184, $196, $215
Supports: $170, $155, $145
Targets: (bullish) $195 $210 (bearish) $170 • $160 • $140 • $120
NVIDIA Trend Profile:
- Short term: Range-bound with a downward bias.
- Medium term: Range-bound phase.
- Long term: Bullish.