The cryptocurrency is on the verge of entering a phase of “free upward movement.” Will it make it?
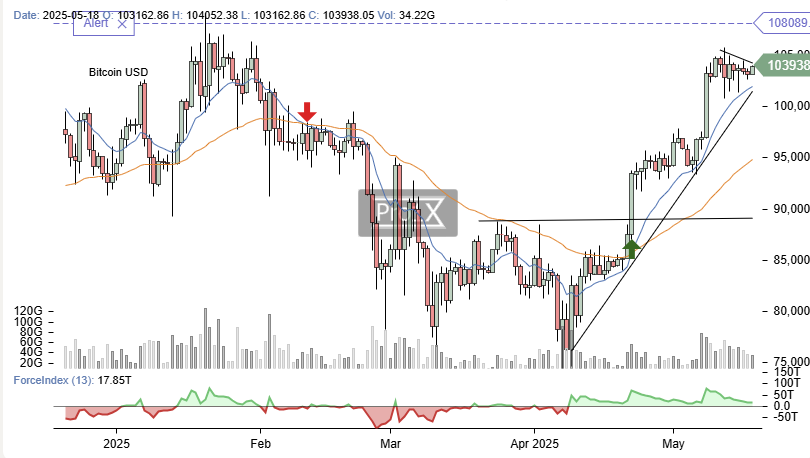
The double intraday bottom formed in early April around $75,000 acted as support. However, it wasn’t until the clear recovery with volume above $89,000 that Bitcoin confirmed a short-term bullish reversal structure. Two key points to note:
As seen in the chart from https://pro1x.com/symbol/BTC-USD, after consolidating the aforementioned double bottom, its Force Index 13 entered positive territory. This indicator, quite reliable for this asset, has been accompanying the current bullish momentum so far.
The breakout above $89,000 was accompanied and reinforced by a bullish crossover between its 20- and 50-session moving averages. This is a potential bullish signal that has strengthened Bitcoin’s short-term structure.
The historical highs (around $108,000) are the key level to break. A decisive breakout above this would push the asset into “free upward movement,” a favorable scenario for a second major bullish rally toward the $120,000-$125,000 range. On the flip side, a loss of the critical technical (and psychological) level at $100,000 would trigger a breach of its short-term bullish trendline, a potential corrective signal that could induce a “healthy” profit-taking phase, followed by a new consolidation of levels.
Top Traders League
Resistences: $108,000
Supports: $100,000, $95,000, $89,100
Targets: (bullish) $106,000, $120,000-$125,000 (bearish) $98,000, $89,000, $76,000
Bitcoin Trend Profile:
- Short term Bullish.
- Medium term: Bullish.
- Long term: Bullish.