Optimus optimism lifts shares toward fresh record highs, but valuation and key technical levels loom.
Leer este artículo en español 🇪🇸
When investors think Tesla, they no longer think only “EV maker.” The stock is increasingly trading like a broader platform story—one that markets are starting to price as a potential winner in the next big cycle: AI-driven robotics.
The rollout of Optimus, Tesla’s humanoid robot, has reignited medium-term expectations around what the company could become beyond cars. That narrative shift matters. The market has welcomed the idea that Tesla could diversify its monetization channels, expanding the addressable opportunity set and reducing reliance on a single core engine. The result has been clear in price action: enthusiasm around Optimus has helped push the shares back toward all-time highs.
Still, the bullish story runs into a hard reality: size and valuation. With a market capitalization above $1.6 trillion, Tesla is no longer a stock that can move higher on hope alone for long stretches. The rich valuation multiples it commands, combined with the uncertainty hanging over the broader AI theme and cross-market factors, could complicate the next leg up over the coming weeks—even if the primary trend remains constructive.
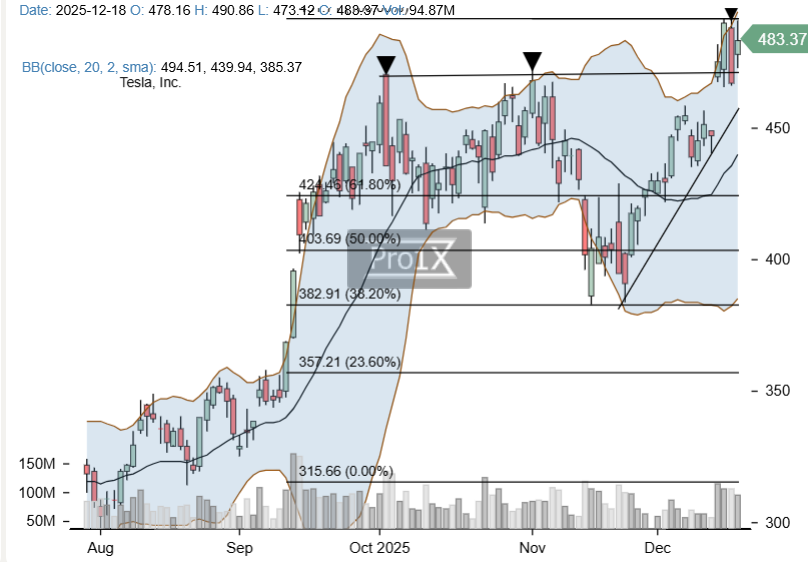
Technically, however, the setup is still favorable. Tesla remains in what technicians call “blue-sky territory”—a breakout phase where the stock is effectively searching for new highs without major overhead resistance, as long as key supports hold.
The level to beat: $490–$500
The $490–$500 zone is now the main obstacle. A clean, decisive daily close above this band would signal renewed upside continuation and could open the door to a run toward $525–$540.
Risk markers: $459, then $430
On the downside, the chart draws clear lines:
- A break below $459—the lower edge of the bullish breakout gap—would be the first technical warning that momentum is fading.
- A loss of $430 would be a more meaningful deterioration, introducing a trend weakness signal that could trigger a deeper correction.
Bigger-picture support: ~$380
If the selloff were to extend, the next major reference point sits around the $380 area, where the stock previously carved out a significant weekly double-bottom—a zone likely to attract renewed demand if revisited.
If Tesla can’t decisively clear $490–$500, the risk of a near-term shakeout grows—but as long as $459 and $430 remain intact, the broader uptrend narrative stays alive and the stock retains the potential to press into fresh highs.
So the real question is: are markets pricing Optimus as a long-term second growth engine—or simply chasing the next AI-driven headline until the chart forces a reality check?
Note: This is technical analysis for informational purposes only and does not constitute investment advice.
Top Traders League
Resistences: $490 • $500 • $540
Supports: $459 • $430 • $380
Targets: (bullish) $520 • $540 (bearish) $460 • $435 • $360
Alphabet Trend Profile:
- Short term Bullish.
- Medium term: Bullish.
- Long term: Bullish.