
Why pairing weakness at resistance with strength near support can be a high-quality toolkit for range-bound markets like today’s.
Leer este artículo en español 🇪🇸
Context & set-up
Near-term, markets have effectively moved from “trend” to “range management”:
- S&P 500 has stalled between roughly 6,550 and 6,920.
- Euro Stoxx 50 has been boxed between 5,500 and 5,800.
In this regime, the main challenge is simple: directional alpha gets hard. Breakouts fail, dips get bought, and a lot of single-name setups turn into noise—late entries, stop-outs, and P&L that feels more like variance than process.
But a range-bound tape doesn’t mean a quiet tape. It usually means rotation.
Sector and cross-sector rotation
The market has become more skeptical about the monetization path of heavy AI investment. The question is no longer “who’s investing in AI?” but “who turns that investment into durable cash flow?” The uncertainty around the payback of large AI spend (think Oracle-type capex narratives, and the ongoing cash burn dynamic around OpenAI) has introduced friction in parts of tech and pushed incremental capital toward cyclicals (banks) and, at times, defensives.
Intra-sector rotation—especially within technology
We’ve also seen meaningful dispersion within tech. Mega-cap AI-exposed names such as Microsoft, Nvidia, Oracle, Broadcom have taken notable hits, while more “traditional” large-platform tech has held up better (Amazon, Apple). Google has been a stand-out on the back of strong reception to recent Gemini 3 releases—helped by a key structural edge the market values in this phase: a mature distribution channel and less visible near-term economic leakage versus the “burn-first, monetize-later” model.
Bottom line: indices may be stuck in a range, but the tape underneath is highly directional. That’s exactly where long/short pair structures can shine.
Top Traders League
Double-leg pairs: bearish + bullish, a solid framework with “bounded” exposure (if built properly)
A long/short pair is a straightforward statement:
“I’m not betting on the market. I’m betting that A will underperform B.”
That matters in a sideways market, because your return driver becomes the spread, not the index.
- If the market sells off: ideally, your short leg drops more (or sooner) than your long leg.
- If the market rallies: ideally, your long leg leads and your short leg lags.
- If the market chops: the spread can still compress/mean-revert when you’re leaning on clear resistance and support.
This is often described as “limited risk,” but it’s more accurate to call it re-shaped risk. You’re not removing risk—you’re moving it from outright beta to:
- relative performance risk,
- correlation breakdowns,
- idiosyncratic event risk (earnings/news),
- and execution/borrow/financing dynamics (especially on the short leg).
A practical best practice: pair within the same sector when possible. Market psychology and flows tend to operate at the sector level. If tech rips, you want your short to rise less than your long. If tech breaks, you want your short to fall more than your long.
And the key mindset shift:
You’re not trying to make money on both legs. You’re trying to make more on the winner than you lose on the loser—with the spread doing the heavy lifting.
The pairs (closes as of 12/18/2025)
Below are the four pair ideas, with a chartist read, invalidation logic, and what would confirm the thesis.
Pair 1: TESLA (short) vs MICROSOFT (long)
Closes (12/18/25): TSLA $483.37 (bearish leg) / MSFT $483.98 (bullish leg)
Sizing: 50 shares each leg (clean dollar-neutral starting point)
The spread thesis
- TSLA is pressing into a well-defined resistance zone ($480–$490) with strong overbought conditions and an extremely demanding valuation backdrop (P/E > 330x). In practical terms: when price meets resistance with stretched positioning, the downside “air pocket” risk increases—any marginal disappointment can spark a fast reset.
- MSFT has been punished on near-term AI investment uncertainty (its OpenAI linkage is a headline drag), but chart-wise it’s sitting on a structural support band ($470–$480)—the kind of area where buyers tend to defend due to order memory and positioning.
You’re essentially selling weakness into resistance and buying resilience near support.
Technical read (pure chartist)
- TSLA (short leg)
- Resistance is not a single print—it’s a supply zone. Repeated failure to close and hold above $490 is the tell.
- Watch for classic exhaustion: rejection wicks, failed breakouts, weakening momentum as it pushes the zone.
- MSFT (long leg)
- The $470–$480 zone matters because it’s where “real money” often steps in.
- The setup improves materially if MSFT begins to print higher lows off that band while TSLA stalls at resistance.
Risk management / invalidation
- TSLA invalidation: acceptance above $490 (not a touch—sustained closes + follow-through).
- MSFT invalidation: clean breakdown below $470 with acceleration.
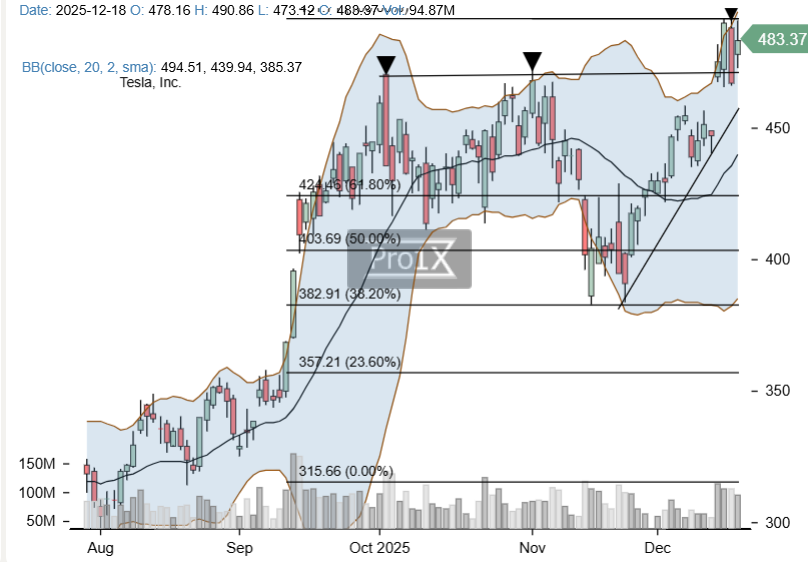
Figure 1. TESLA (TSLA) daily closing prices.
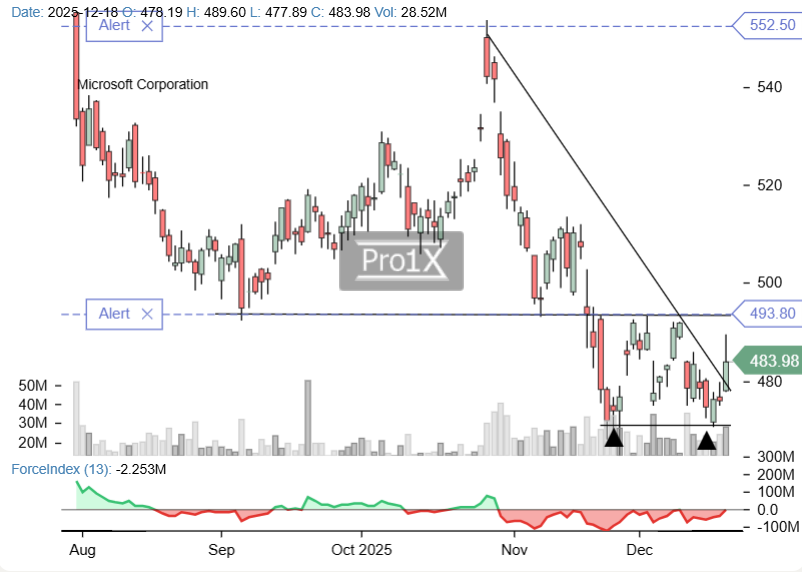
Figure 2. MICROSOFT (MSFT) daily closing prices.
Pair 2: PALANTIR (short) vs NVIDIA (long)
Closes (12/18/25): PLTR $185.69 (short) / NVDA $174.14 (long)
Sizing: 100 shares each leg
The spread thesis
- PLTR is pushing into $190–$195 resistance with overbought conditions and a potential large-scale Head-and-Shoulders forming. Add valuation strain (P/E > 440x, even richer than TSLA), and the risk asymmetry near resistance becomes obvious: the market needs very little to justify de-risking.
- NVDA has been in a tight $170–$195 range since late July, including a brief false breakout toward ~$210. That “trap and back into range” behavior often strengthens level integrity. The 200-day moving average sits around $160, reasonably close as a structural reference.
This is a classic: short the name stretched at resistance, long the name compressing near range support with nearby invalidation.
Technical read
- PLTR (short leg)
- The key is whether $195 repeatedly rejects price. Failed breakouts tend to produce sharp mean reversion.
- If the H&S narrative starts to “activate,” you typically see sellers appear earlier and more aggressively on each test.
- NVDA (long leg)
- Range trading is about clarity: buy near support, cut quickly if it breaks.
- The false break can be interpreted as a cleanup of weak hands—useful when you’re buying near the bottom of the range.
Risk management
- NVDA stop: $165 (as specified).
- PLTR invalidation: acceptance above $195 with sustained closes and continuation.
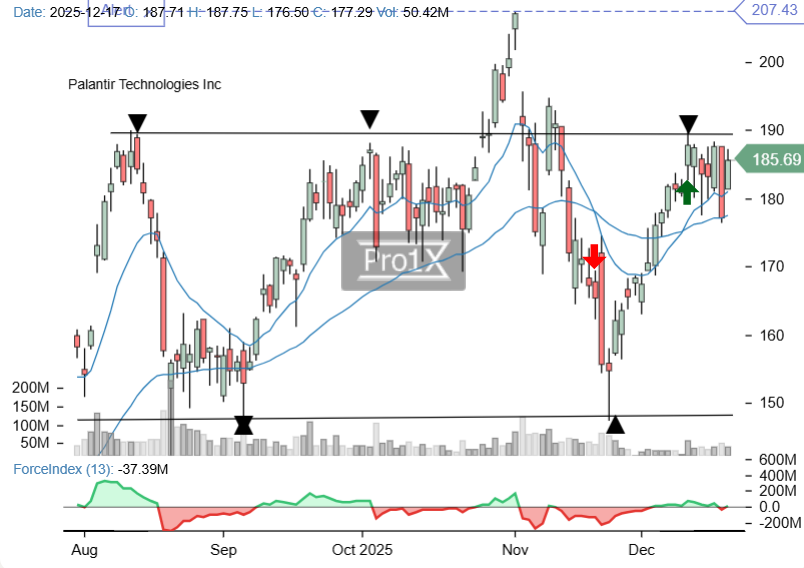
Figure 3. PALANTIR (PLTR) daily closing prices.
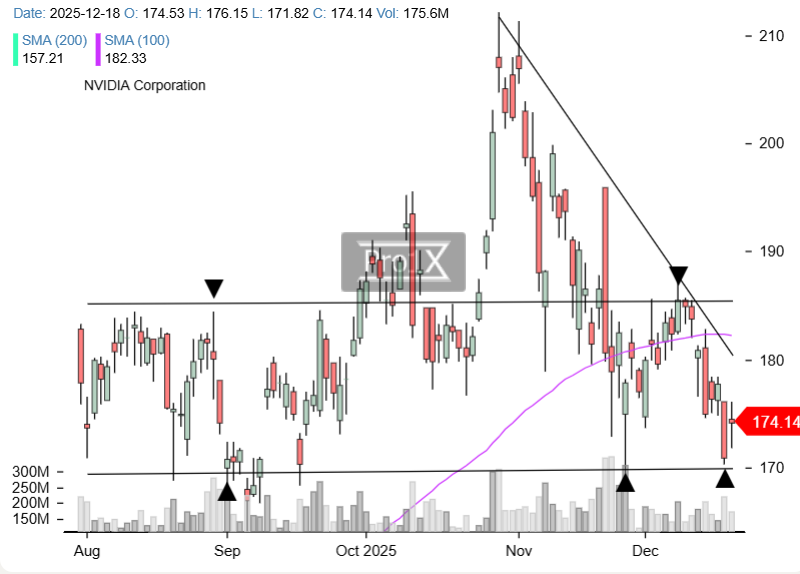
Figure 4. NVIDIA (NVDA) daily closing prices.
Pair 3: S&P 500 (short) vs Euro Stoxx 50 (long)
Closes (12/18/25): S&P 6,774 (short) / Euro Stoxx 5,741 (long)
Sizing: 100 index points each (1 point per index, as specified)
https://pro1x.com/symbol/%5EGSPC
https://pro1x.com/symbol/%5ESTOXX50E
The spread thesis
This is a regional relative-value expression:
- The S&P 500 is showing weakness at zonal resistance, with a sequence of lower highs and lower lows, plus moving-average compression—often the pre-condition for a sharper move once the coil resolves. Leadership fatigue is visible.
- The Euro Stoxx 50, despite having already narrowed some spread versus the S&P, still presents a cleaner near-term structure with room to grind higher. Resistance is 5,800, support is 5,670.
You’re positioning for Europe to outperform the U.S. on the next swing, even if both remain range-bound.
Technical read
- S&P 500 (short leg)
- Lower highs/lows into resistance is a distribution signature: the market is trying to push higher, but each push gets sold sooner.
- Compression of moving averages often precedes expansion—your short benefits if the resolution is down or if the S&P simply lags.
- Euro Stoxx (long leg)
- The entire setup hinges on 5,670 holding.
- A push toward 5,800 is the obvious first target zone.
Practical note on index pairs
Dollar-neutral sizing isn’t the same as risk-neutral. Volatility, currency exposure, and sector composition can shift the effective hedge. Treat the spread as the tradeable object and define invalidation on the spread—not only on each index in isolation.
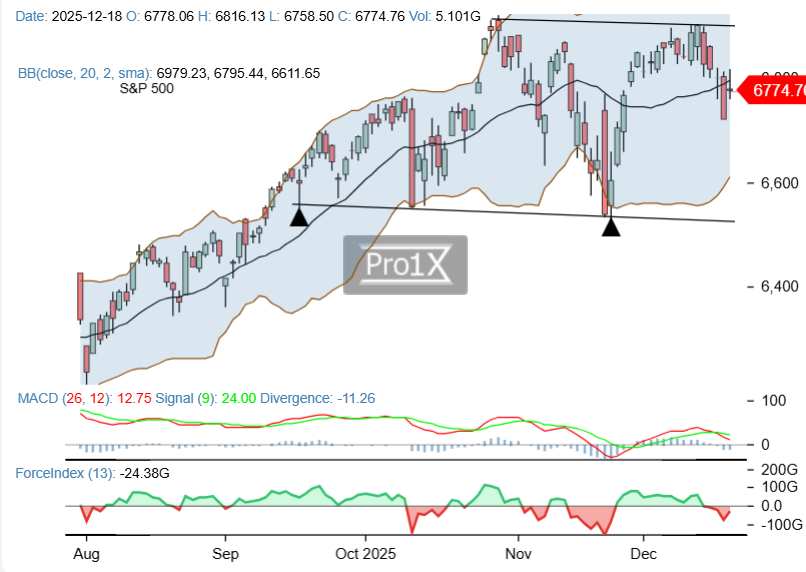
Figure 5. S&P 500 (^GSPC) daily closing prices.
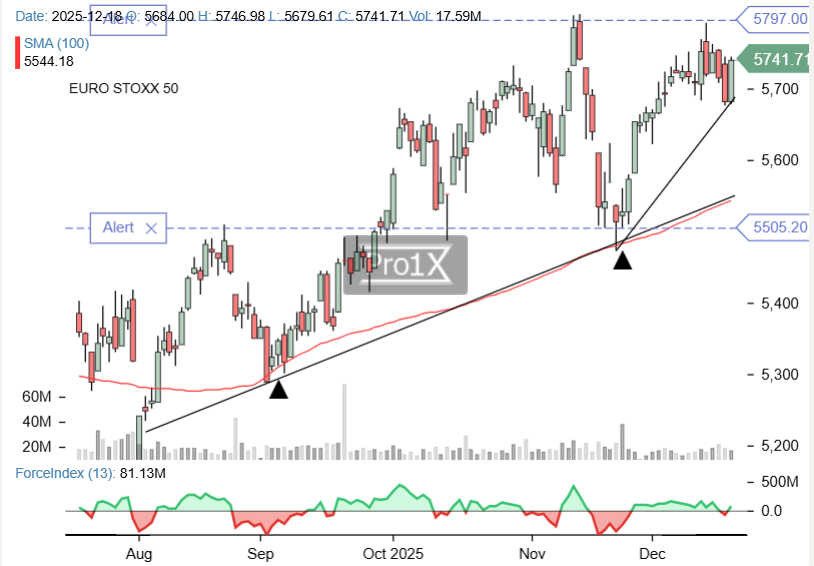
Figure 6. EUROSTOXX 50 (^STOXX50E) daily closing prices.
Conclusions
Range-bound markets can be deceptively punishing because they invite you to keep forcing directional views. Pair structures sidestep that trap. They let you monetize what the tape is actually offering right now: dispersion.
These long/short pairs work best when you:
- sell into clear resistance where positioning is stretched and the risk asymmetry flips,
- buy into clean support where downside can be defined,
- and stay disciplined about invalidation (acceptance above resistance, breakdown below support).
In other words, you don’t need the market to trend. You need your read on relative strength vs relative weakness to be sharper than the consensus.
And a final thought worth keeping front of mind in this regime:
In a range, the question isn’t “what goes up?”
It’s “what’s priced for perfection near resistance… and what’s priced for disappointment near support?”
If you’ve made it this far, you already know the point: in ranges, opinions are cheap—the spread is what pays. Thanks for reading. See you in the next one.