Gemini 3 strengthens Alphabet’s competitive edge and pushes the stock to new all-time highs.
Leer este artículo en español 🇪🇸
n the early stages of the artificial intelligence race, Alphabet appeared to be lagging behind some of its peers. However, the company has moved decisively to close that gap. With renewed involvement from co-founder Sergey Brin, Alphabet has rapidly regained momentum and now finds itself in a position of clear leadership.
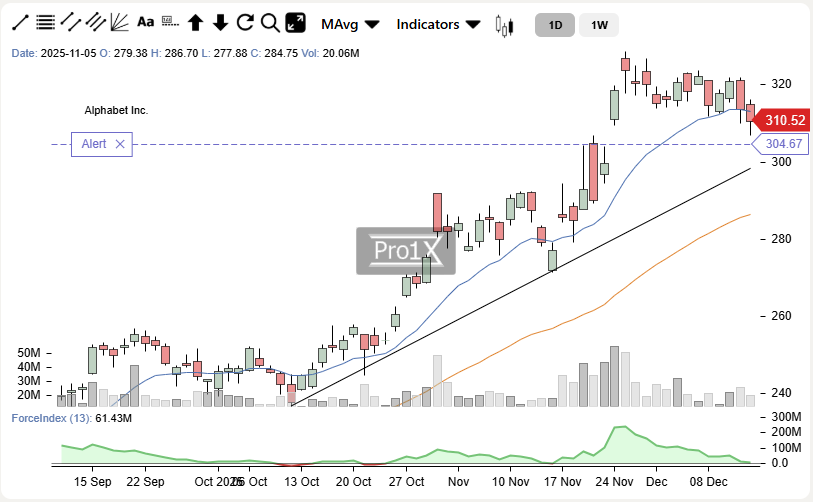
This strategic shift has not only repositioned Alphabet at the center of the AI conversation, but it has also been decisively validated by the market. The stock has pushed to new all-time highs, reflecting growing confidence in the company’s long-term AI strategy.
The key driver is not Gemini 3 alone. Alphabet’s true advantage over competitors such as OpenAI, Microsoft, or Anthropic is structural rather than incremental. Alphabet is not merely competing at the model level — it competes across the entire AI stack.
The company controls the full vertical:
- Proprietary infrastructure through custom-designed TPUs
- Access to massive, continuously refreshed data sources via Android, Search, and YouTube
- Development of state-of-the-art foundation models
- And, critically, a unique global distribution channel, with over 4 billion Android smartphones running Google services
This end-to-end control of the AI value chain creates a formidable competitive moat and significantly raises the barriers to entry for would-be challengers.
The market has taken note. Alphabet shares have moved decisively above the $300 level, setting fresh all-time highs. At the same time, valuation metrics are beginning to exert pressure at current levels.
From a technical perspective, this has translated into a sideways consolidation phase following the latest advance. The key question now is whether the stock has enough momentum for another leg higher into year-end, or whether a healthier, more structural consolidation lies ahead.
Such a consolidation would not necessarily be bearish. On the contrary, it could allow the stock to revisit former resistance levels — previous multi-year highs now acting as key support zones — and build a stronger base for the next move.
For now, one technical reference remains firmly in focus: the bullish breakout gap created after earnings, located around $304. As long as this gap remains open, the broader technical bias remains constructive.
The question is simple:
How long will that gap remain open?
We may not have to wait long for the answer.
Top Traders League
Resistences: $320 • $325 • $340
Supports: $304 • $280 • $255
Targets: (bullish) $320 • $350 (bearish) $280 • $265 • $240
Alphabet Trend Profile:
- Short term Range-bound.
- Medium term: Bullish.
- Long term: Bullish.